Elastic Datasource
数据源
Beats
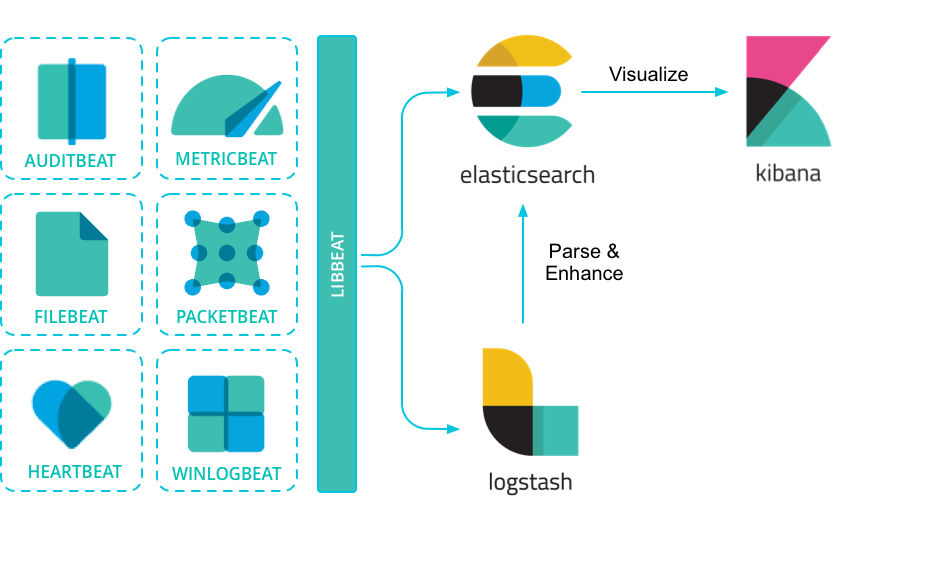
Filebeat
Metricbeat
Metricbeat is a lightweight way to send system and service statistics:
- system-level CPU usage, memory, file system, disk IO, and network IO statistics, as well as top-like statistics for every process running on your systems.
- collect metrics from services like Apache, Jolokia, NGINX, MongoDB, MySQL, PostgreSQL, Prometheus, and more.
Packetbeat

Winlogbeat
数据处理
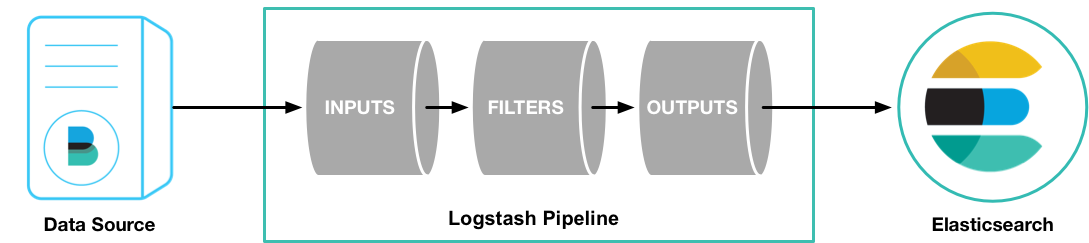
Logstash
Event ordering:https://www.elastic.co/guide/en/logstash/current/processing.html#event-ordering
插件介绍
Inputs
file:reads from a file on the filesystem, much like the UNIX command tail -0F
syslog:listens on the well-known port 514 for syslog messages and parses according to the RFC3164 format;
Filters
-
grok:parse and structure arbitrary text.
-
mutate:rename, remove, replace, and modify fields in your events.
-
geoip
-
date:==parses out a timestamp and uses it as the timestamp for the event (regardless of when you’re ingesting the log data).==
Accessing event data and fields in the configuration | Logstash Reference [7.15] | Elastic
Logstash configuration examples | Logstash Reference [7.15] | Elastic
Outputs
- elasticsearch
- file
- ……
采集器管理
Fleet provides a web-based UI in Kibana to add and manage integrations for popular services and platforms, as well as manage a fleet of Elastic Agents.
Install Elastic Agent (Fleet)
设置Fleet
修改Elasticsearch和Kibana集群的URL。
使用集中管理需要创建一个具有创建API keys并写入logs-*和metrics-*索引权限的用户(使用超级用户登录Kibana后可自动创建)。
Fleet作为服务运行于一个或多个Elast Agent上。
下载安装
Ubuntu
curl -L -O https://artifacts.elastic.co/downloads/beats/elastic-agent/elastic-agent-<version>-amd64.deb
sudo dpkg -i elastic-agent-<version>-amd64.deb
sudo elastic-agent enroll -i <kibana_url> <enrollment_token> # 1,3
sudo systemctl enable elastic-agent
sudo systemctl start elastic-agent  # 2
没有
systemd的系统(如WSL),使用service启动服务:service elastic-agent start由于登记为服务,因此代理会在系统重启时启动启动。
kibana_url和enrollment_token可在代理添加页面找到。安装目录位于
/opt/Elastic/Agent。
Windows
从解压目录执行安装命令:
.\elastic-agent.exe install -i -f \
	--kibana-url=<kibana_url> \
	--enrollment-token=<token>
Download the Elastic Agent Windows zip file from the downloads page.
安装目录位于:
C:\Program Files\Elastic\Agent。
代理管理
需要将集群使用的证书(Kibana)添加到代理所在系统(生成证书时要在配置文件中添加集群所使用的域名)。
Windows需要将证书添加到
LocalMachine目录下。
从Fleet管理界面修改代理配置策略以及解除代理注册。
使用elastic-agent enroll命令重新注册到Fleet。
Install Elastic Agent (Manually)
配置文件
使用Fleet生成配置文件elastic-agent.yml,手动修改配置。
outputs:
  default:
    type: elasticsearch
    hosts:
      - 'http://localhost:9200'
    username: ES_USERNAME
    password: ES_PASSWORD
创建代理用户
POST /_security/role/standalone_agent
{
  "cluster": ["monitor"],
  "indices": [
    {
      "names": ["logs-*", "metrics-*", "events-*", ".ds-logs-*", ".ds-metrics-*", ".ds-events-*"],
      "privileges": ["write", "create_index", "indices:admin/auto_create"]
    }
  ]
}
安装
无需提供参数,安装程序将使用本地配置文件进行初始化。
Upgrade Elastic Agent
sudo elastic-agent upgrade <version-number>
卸载
cd C:\Program Files\Elastic\Agent
.\elastic-agent.exe uninstall
数据源
Elastic Endpoint Security
卸载
以管理员运行:
cd C:\Program Files\Elastic\Endpoint
.\elastic-endpoint.exe uninstall